

Applications Failure
Check Accessibility
A two-tier application has a web and database server. The database pods host a database and serve the web servers through a database server. The web server is hosted on a web pod and serves users through the web service.
How your application is configured?
DB—>DB Service –-> web –--> web service –--> user
Depending upon how much we know about failure we choose to start from.
In our case user issue with accessing the application. We will start with the application front end. Use standard ways of testing. If the application is accessible.
Check service Status.
- If it is a web application check if the webserver is accessible on the IP of the node port using curl.
curl http://web-service-ip:node-port
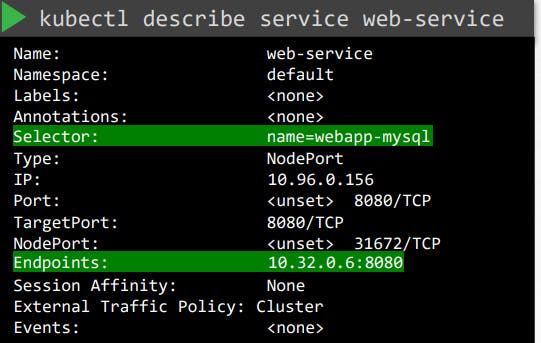
kubectl describe service web-service
check it to discover the endpoint for the pod web.
Endpoints: 10.32.0.6:8080
If it does not check service to pod discovery. Compare the selectors configured in the service to once on the pod.
Pod
apiVersion: v1
kind: Pod
metadata:
  name: webapp-mysql
  labels:
    app: example-app
    name: webapp-mysql
spec:
  containers:
  - name: webapp-mysql
    image: simple-webapp-mysql
    ports:
    - containerPort: 8080
Service
MAKE SURE THEY MATCH.
Check Pod
Check whether the pod is running or not
Here's an example of how the output of the kubectl get pod command might look like this:
kubectl get pod
NAME      READY   STATUS    RESTARTS   AGE
webapp    1/1     Running   0          3m
database  1/1     Running   1          5m
cache     2/2     Running   2          7m
The status of the pod, as well as the number of restarts, can give you an idea of
whether the application on the pod is running or is getting restarted.
Check the events related to the pod using the described command.
To describe a Pod named webapp-mysql and show its events, you can run the following command:
kubectl describe pod webapp-mysql
Here's an example of how the output of the kubectl describe pod command might look like, with events included:
Name:         webapp-mysql
Namespace:    default
Priority:     0
Node:         worker-1/10.0.0.1
Start Time:   Tue, 10 May 2022 12:34:56 -0700
Labels:       app=example-app
              name=webapp-mysql
Annotations:  <none>
Status:       Running
IP:           10.244.1.3
Containers:
  webapp-mysql:
    Container ID:   docker://abcdef1234567890
    Image:          simple-webapp-mysql
    Image ID:       docker-pullable://simple-webapp-mysql@sha256:1234567890abcdef
    Port:           8080/TCP
    Host Port:      0/TCP
    State:          Running
      Started:      Tue, 10 May 2022 12:35:01 -0700
    Ready:          True
    Restart Count:  0
    Environment Variables:
      <none>
Conditions:
  Type           Status
  Initialized    True
  Ready          True
  PodScheduled   True
Volumes:
  <none>
QoS Class:       BestEffort
Node-Selectors:  <none>
Tolerations:     node.kubernetes.io/not-ready:NoExecute op=Exists for 300s
                 node.kubernetes.io/unreachable:NoExecute op=Exists for 300s
Events:
  Type    Reason     Age   From               Message
  ----    ------     ----  ----               -------
  Normal  Scheduled  52m   default-scheduler  Successfully assigned webapp-mysql to worker-1
  Normal  Pulling    52m   kubelet, worker-1  Pulling image "simple-webapp-mysql"
  Normal  Pulled     52m   kubelet, worker-1  Successfully pulled image "simple-webapp-mysql"
  Normal  Created    52m   kubelet, worker-1  Created container
  Normal  Started    52m   kubelet, worker-1  Started container
In this example output, you can see that the Events section shows that the Pod was successfully scheduled to worker-1, and its container was created and started without issues.
Check the logs
Check the logs of the application using the logs command.
The kubectl logs command is used to print the logs of a container in a pod.
kubectl logs web
OR
In the command you provided, web is the name of the pod and -f is used to stream the logs. The --previous option is used to print the logs of the previous container instance if the current container has been restarted.
kubectl logs web -f --previous
When you run this command, it will stream the logs of the web pod's container, and if the container is restarted, it will also print the logs of the previous instance of the container. The -f option will keep the command running and update the logs in real-time as new logs are generated.
Check the logs of the DB pod
kubectl logs DB
If the pod has multiple containers, you can specify the name of the container whose logs you want to see by adding the container name after the pod name, separated by a slash:
kubectl logs DB/mysql
This will print the logs of the mysql container running in the DB pod.
Note that if the container has terminated or was restarted, running this command will only show the logs from the current instance of the container.
If you want to see the logs from a previous instance, you can use the --previous option is as follows:
kubectl logs DB/mysql --previous
This will print the logs from the previous instance of the mysql container, if any.
Control plane failure
Check Node Status
The
kubectl get nodescommand is used to list all the nodes in the Kubernetes cluster.kubectl get nodesOutput:
 NAME      STATUS   ROLES    AGE     VERSION
 worker-1  Ready    <none>   8d      v1.13.0
 worker-2  Ready    <none>   8d      v1.13.0
Check Controlplane Pods
Check the status of the pods running on the container.
kubectl get podsCheck Controlplane Services
If we had control plane components deployed as pods, in case of a cluster deployed with the Kubeadm tool, then we can check to make sure that the pods in the kube-system namespace are running.
kubectl get pods -n kube-systemIf the control plane components are deployed as services, then check the status of the services such as the kube-apiserver,controller-manager and scheduler on the master nodes.
 service kube-apiserver status
 service kube-controller-manager status
 service kube-scheduler status
On the worker node check
 service kubelet status
 service kube-proxy status
Check Service Logs
Check logs of control plane components
In the case of Kubeadm use kubectl logs command to view the logs of pods hosting the control plane components.
kubectl logs kube-apiserver-master -n kube-systemIn the case of services configured natively on the master nodes, view the service logs using the host logging solution. we can use the journalctl utility to view the kube-API servers logs.
sudo journalctl -u kube-apiserver
Worker Node Failure
Check Node Status
kubectl get nodes
NAME    STATUS   ROLES AGE VERSION
Worker-1 Ready    8d    v1.13.0
worker-2 NotReady 8d    v1.13.0
If nodes are reported as not ready check
kubectl describe node worker-1
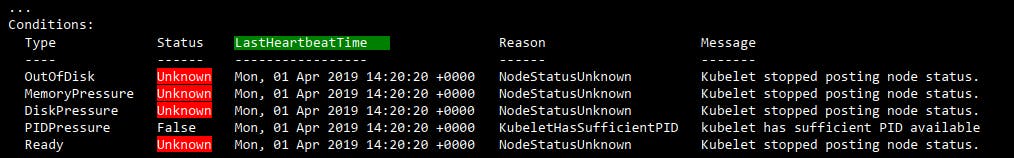
It will show why the node might be failed.
when the node is out of disk space the outofdisk flag is set to true.
when a node is out of memory the memory pressure flag is true.
when disk capacity is low the disk pressure flag is set to true.
When a node is healthy, the Ready flag set a true.
Check node
use this commands
top
df -h
Check Kubelet Status
service kubelet status
sudo journalctl –u kubelet
Check Certificates
Ensure they are not expired and are part of the right group and certificates issued by the right CA.
openssl x509 -in /var/lib/kubelet/worker-1.crt -text
Connect me on
LinkedIn: https://www.linkedin.com/in/aditya-tak/
Hashnod: https://adityatak.hashnode.dev/
#Kubernetes #Devops #Kubeweek #kubeweekchallenge