

Table of contents


No headings in the article.
I. Introduction
A. Explanation of data visualization
Data visualization is the process of representing data and information in a graphical or visual format.
This allows for easier interpretation and analysis of complex data sets and can help to identify trends, patterns, and insights that might not be immediately apparent in raw data.
Data visualization tools can include charts, graphs, tables, and other visual aids that make data more accessible and understandable.
B. Brief introduction to Amazon QuickSight
Amazon QuickSight is a cloud-based business intelligence and data visualization tool offered by Amazon Web Services (AWS).
It allows users to create interactive and visually appealing dashboards and reports that can be accessed and shared across an organization.
QuickSight can connect to a wide variety of data sources, including AWS services like Amazon S3, Amazon RDS, and Amazon Redshift, as well as non-AWS sources like Salesforce, Dropbox, and Excel spreadsheets.
C. Importance of data visualization in business
Data visualization is an essential tool for businesses of all sizes and industries.
It can help managers and decision-makers to quickly understand key metrics and trends, identify areas for improvement or growth, and make informed decisions based on data-driven insights.
Effective data visualization can also help to communicate complex information to stakeholders and clients, improving transparency and trust in the decision-making process.
II. How to Use Amazon Quick Sight for Data Visualization step by step tutorial.
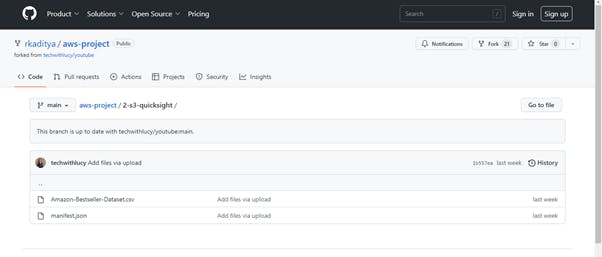
You need to download data and manifest file.
https://github.com/rkaditya/aws-project/tree/main/2-s3-quicksight
Open the given link .Download both files. Use ctrl+s to save files.
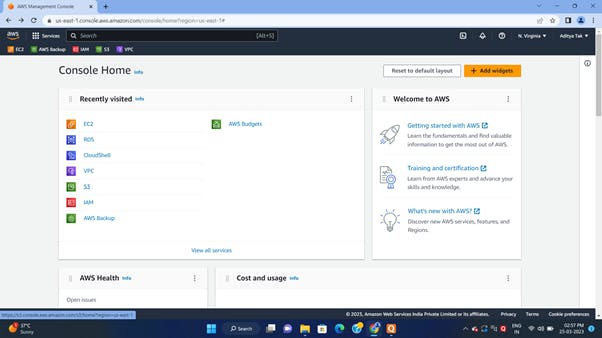
Login to AWS console.
Create s3 bucket
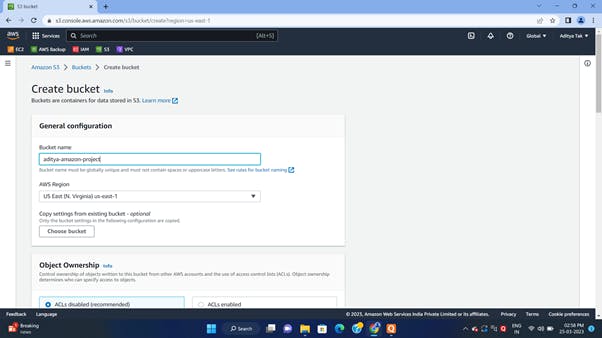
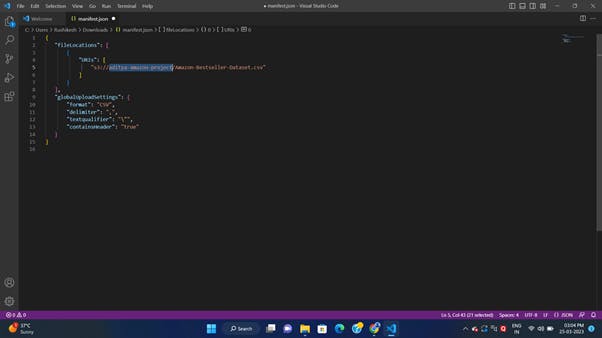
You need to change the bucket name inside of the manifest file with the newly created S3 bucket name.
I changed the manifest file bucket name word with adiya-amazon-project s3 bucket name.
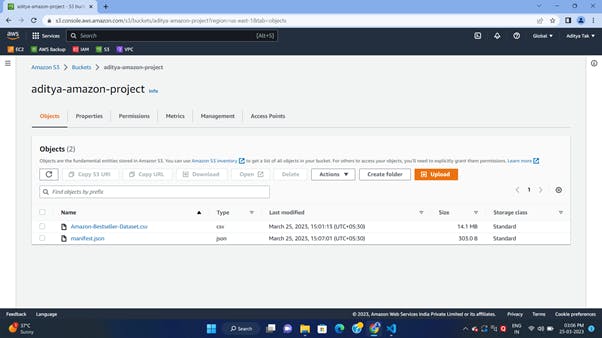
Upload both files in bucket
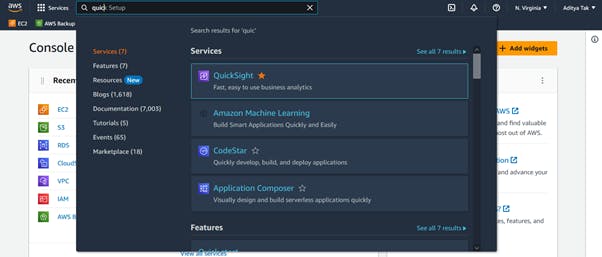
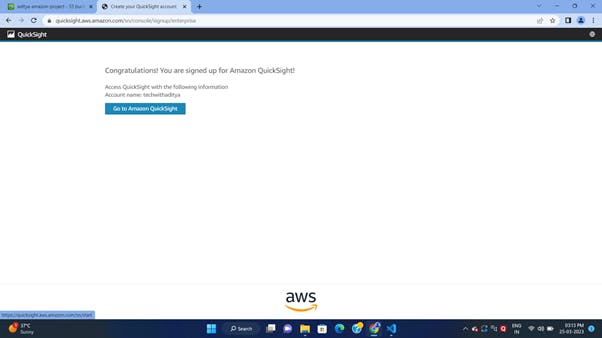
Duplicate the tab and in the console search Quicksight and Sign in
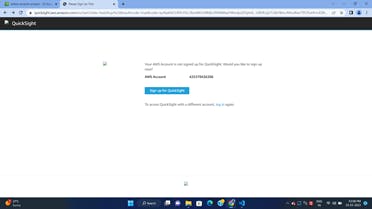
Choose subscription (Don’t forget to unsubscribe after use to avoid unnecessary charges )
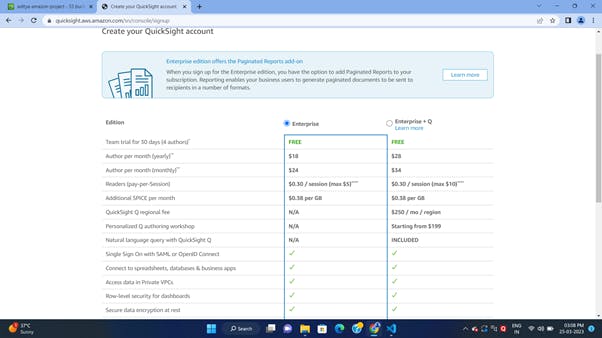
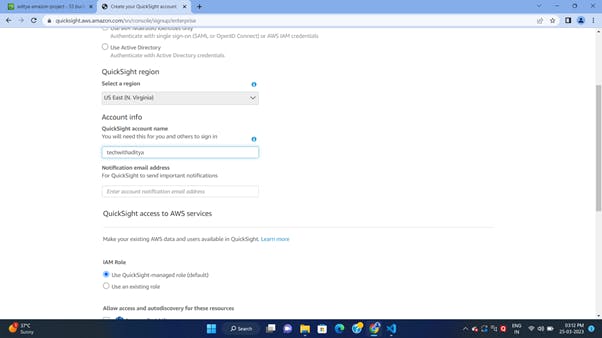
Give account name
Email address
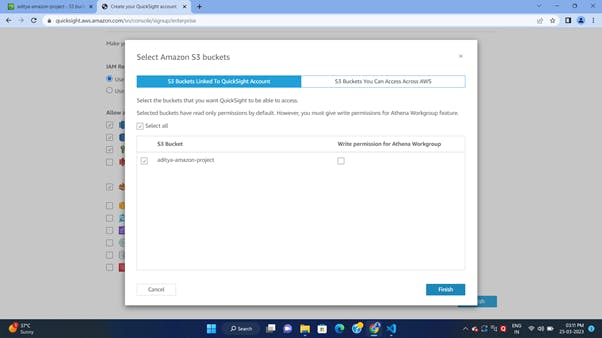
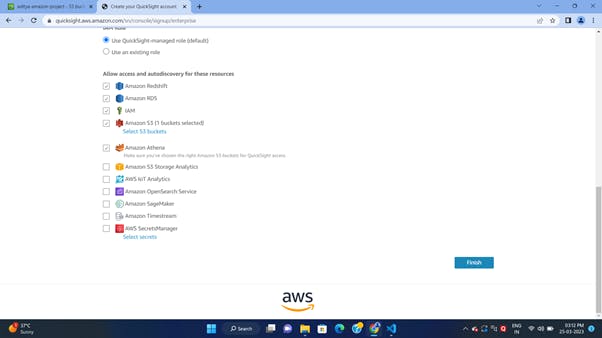
Don’t forget to select s3
Select s3 bucket and finish
Go to Amazon QuickSight
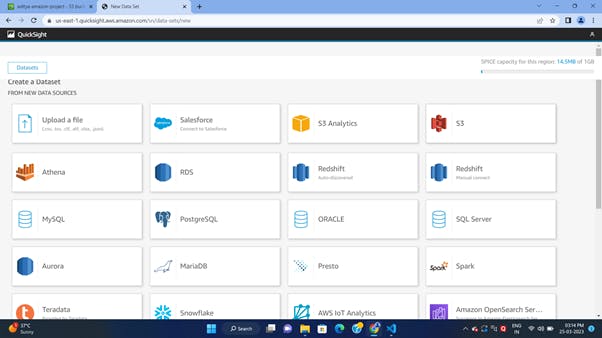
OPEN Datasets
Select the option Create a new dataset
Select S3
Go to S3 bucket.
Open manifest file
Copy S3 URI
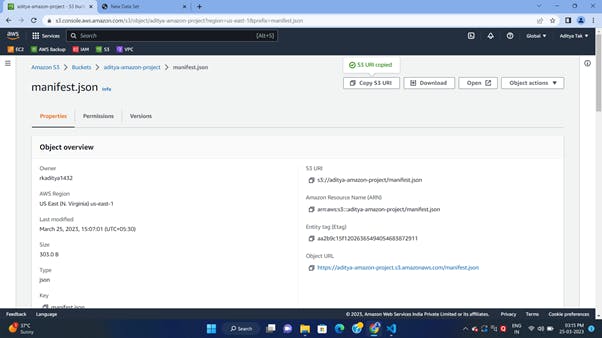
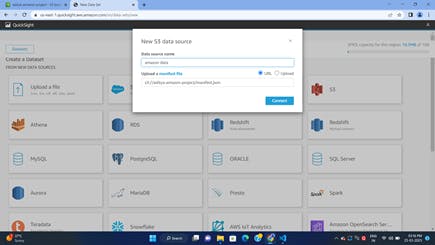
Paste this s3 URI in New Data source in quick sight.
Give data source a name like I have given =amazon data
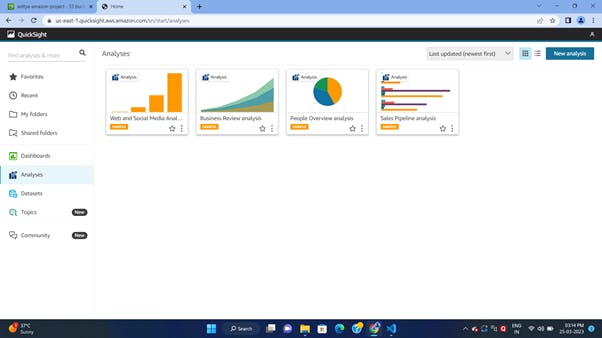
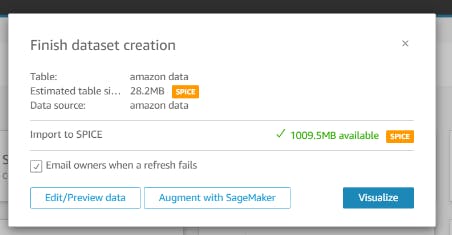
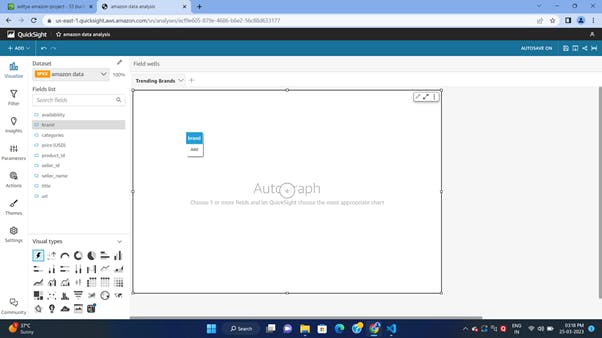
After that select visualise option.
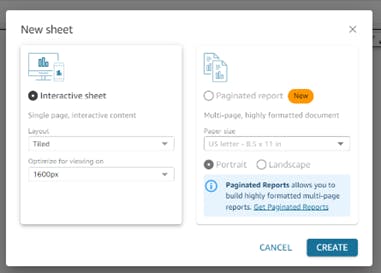
Select Interactive sheet and click on create.
It is ready to use now
Visualizing data using charts and graphs in Amazon QuickSight:
QuickSight offers a variety of built-in charts and graphs that can be customized and styled to match your branding and design preferences.
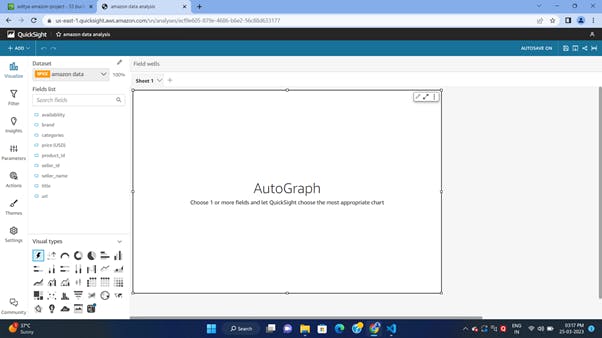
Select and drag the field in char to visualize.
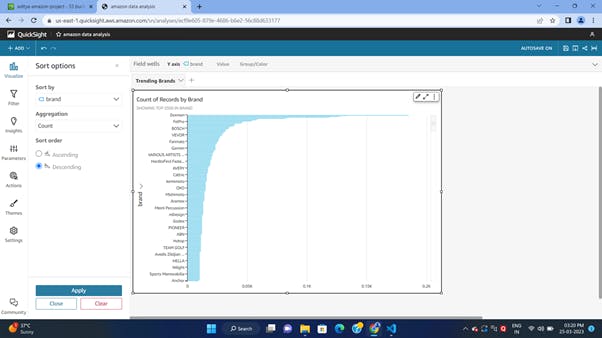
You can choose from options like bar charts, line charts, scatter plots, heat maps, and more.
You can sort them.
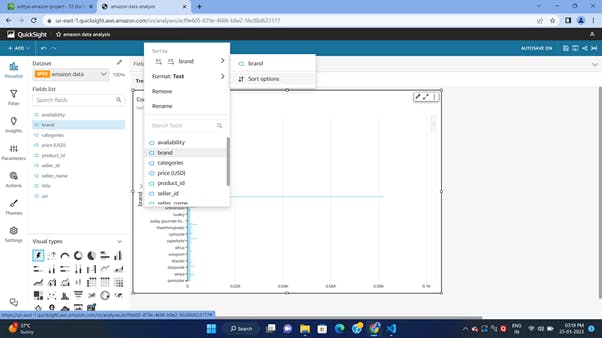
QuickSight also allows for interactive features like drill-downs and hover-over tooltips to provide additional detail and context to your visualizations.
Conclusion
Amazon QuickSight is a powerful tool for data visualization that offers a wide range of benefits and use cases. It allows users to quickly and easily connect to data sources, create data sets, and generate visualizations using a variety of charts, graphs, and other visual elements.
Some of the key benefits of Amazon QuickSight include its speed and ease of use, its integration with other AWS services, and its flexible pricing options. Use cases for Amazon QuickSight include everything from analyzing sales data and customer behavior to tracking website traffic and social media metrics.
If you're interested in trying Amazon QuickSight for yourself, I would encourage you to sign up for an AWS account and give it a try. Whether you're a small business owner or a large enterprise, Amazon QuickSight can help you make sense of your data and gain valuable insights into your business. So why not give it a shot and see how it can benefit you?
Reference